
The site, the EV dashboard, Renewables India with the CEA, and the live Open Access tool.
01 Policy and research
Think tank website development and digital platforms for policy institutions
Tailwebs does think tank website development and builds digital platforms for research institutes and policy bodies: research websites, publication libraries, data portals and dashboards. We start by mapping everything you produce (reports, data, events, people and programmes), then plan one system so policymakers, journalists, researchers and funders find the right work quickly.
03 The challenge
Why it isn't a simple website
- Presenting the work is hard.
- An institution runs many programmes, publishes research in many forms and speaks to several audiences at once: researchers, policymakers, partners, funders and the press. Each needs a different way in. The site has to show how programmes, publications, people and tools connect, and stay easy to keep current as the work grows.
- The tools and dashboards are harder.
- Their data is large, comes from many sources and has to stay accurate. Some examples from our work:
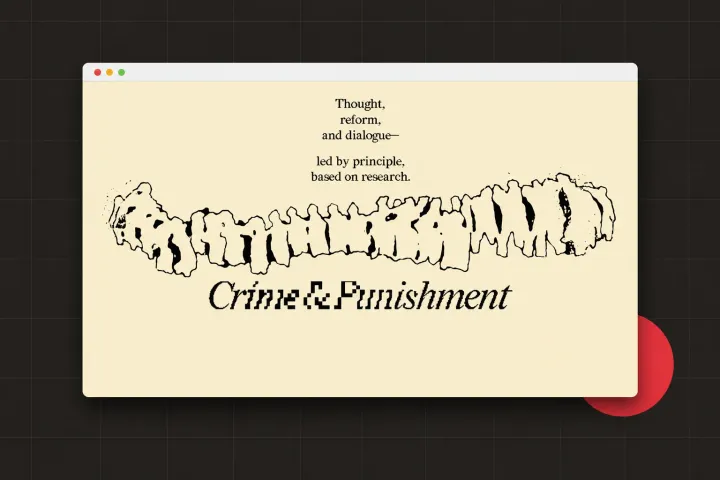
- a database of 7,305 crimes across 370 central laws, each turned into plain language (Vidhi, Crime and Punishment);
- household-survey data for Bengaluru, Kochi and Ahmedabad, shown as a gender-mobility dashboard (WRI India, MobiliseHER);
- calculators and dashboards people use to work things out for themselves, such as the Open Access tool for CEEW's Green Finance Centre;
- dashboards with so many data points that we generate each page's design and logic from a configuration, so new data doesn't mean new code.
04 The ecosystem map
One research organisation, planned as one system.
An ecosystem map shows your whole digital estate on one page: what each part does, how the parts link, and which project sites fold in, stay or retire.
Core siteWho you are, your programmes, and the way into everything else
- Publication libraryEvery report, brief and paper, held once, with its metadata
- Topic hubsA summary, the key work and the experts for each topic
- People pagesEach researcher's work, media and topics
- Data portalDatasets with downloads and methodology notes
- DashboardsCharts people can explore and cite
- AI search or assistantAnswers from your own work, with the source for each
- NewsletterNew work by topic, sent to the people who asked for it
- EventsEach event page becomes an event report
Project microsites: decided one by one
- Folds inBecomes a programme section of the core site
- Stays, with shared designKeeps its own address, with the core site's design and links
- ArchivedTaken down with every link redirected, so citations still resolve
This is the deliverable of our planning phase. You see the whole system, and what each part costs, before anything is built.
05 How we work
How we work
Information architecture
What goes where, for each audience.
Strategy
What the institution should say, and to whom.
Content planning
The structure and the words each page needs.
Design, development and launch
Growth
We read the analytics and improve what people use.
The full delivery process is on how we work.
07 What we build
Policy research website design, data portals and interactive data visualisation
Four parts of the map, each with its own page. Start with the part your team looks after.
- 01/04
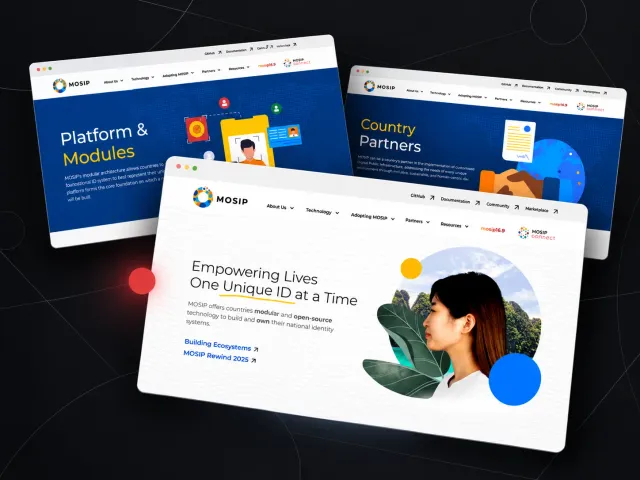
Research websites
- Its job in the map
- The core site and publication library: a content model, author and topic pages, search, and a CMS your team runs.
- Proof on that page
- GFC's whole digital ecosystem, CSEP's website redesign and the MobiliseHER website, plus the MOSIP brand website and eGov's brand websites.
- 02/04
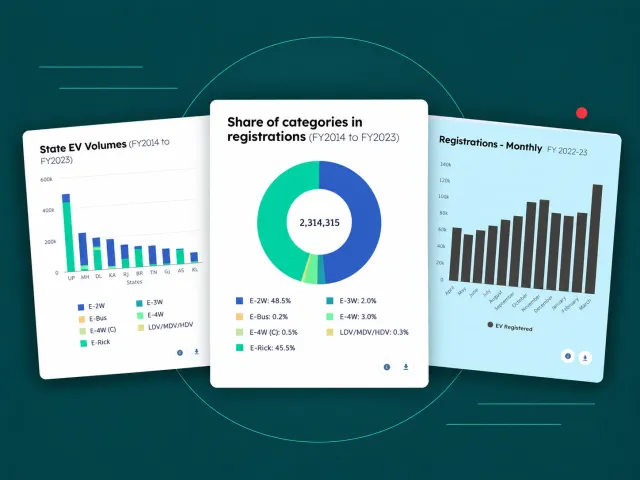
Data portals and dashboards
- Its job in the map
- Datasets people can download, explore and cite, with methodology notes beside the charts.
- Proof on that page
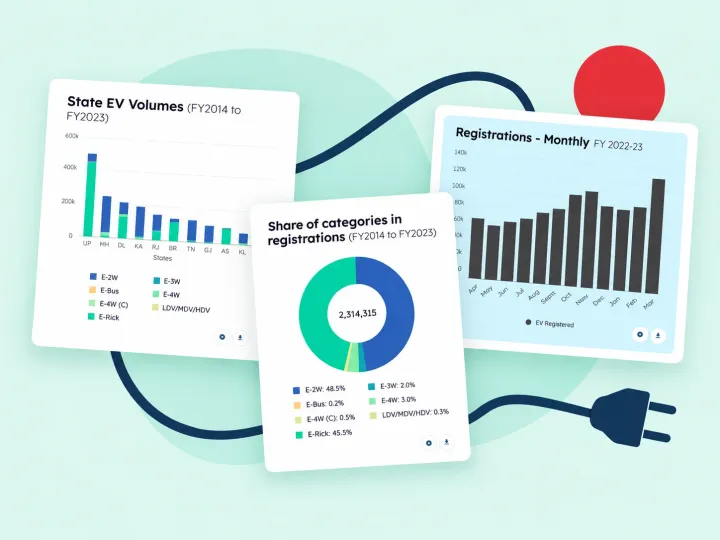
- The MobiliseHER gender-mobility dashboard, the GFC EV dashboard, Renewables India with the CEA, and the GFC Open Access tool.
- 03/04
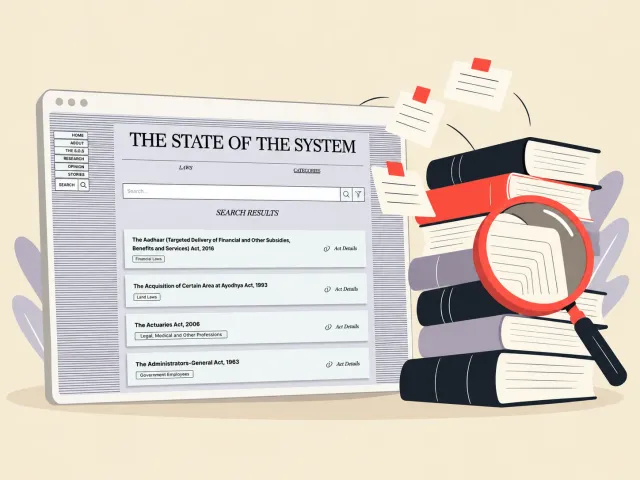
Research content systems
- Its job in the map
- The back office: the taxonomy, PDF to web, AI-assisted extraction and tagging, and search that cites its sources.
- Proof on that page
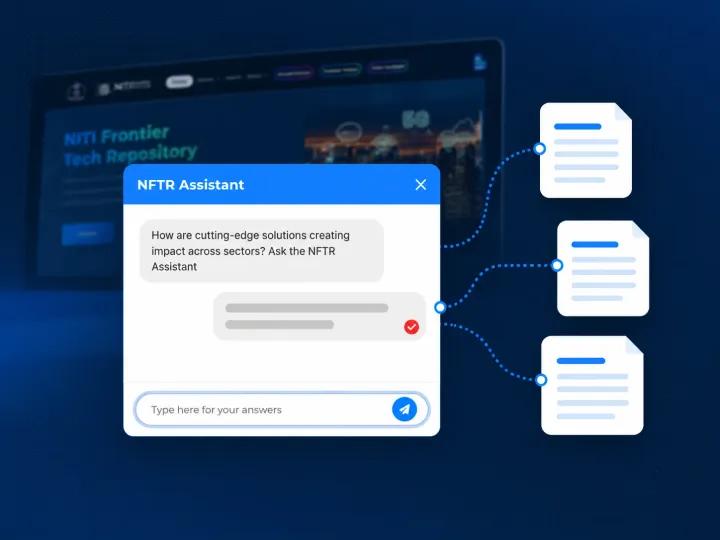
- Vidhi's Crime and Punishment database (AI extraction and tagging) and the NITI Aayog Frontier Tech Repository portal, with the NFTR Assistant built in (answers with sources).
- 04/04
Websites for digital public goods
- Its job in the map
- Websites for open platforms and public digital infrastructure.
- Proof on that page
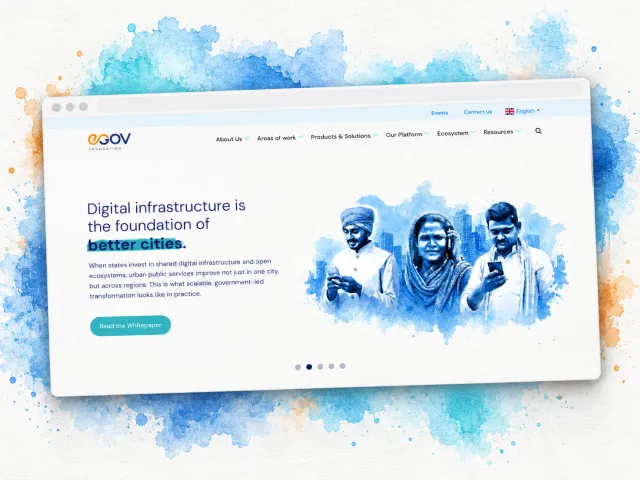
- The MOSIP brand website and the MOSIP Marketplace, and eGov's brand websites (egov.org.in, with help on egov.global).
The services behind these parts: data visualisation services, AI chatbot development, and tool digitalisation for Excel models and calculators that should be web tools.
09 Who we have built for
Research institute websites, dashboards and tools we have built
Sites, dashboards and tools for eight research and policy institutions, each one a part of the ecosystem map.
Its whole digital ecosystem: the site, the EV dashboard, Renewables India and the Open Access tool
The site and the tools people use: the EV dashboard (an EV sales-penetration forecast to 2030 and RTO-level data on a map), Renewables India with the CEA (automated reports) and the live Open Access tool. The two dashboards see 10,000+ uses a month, and state agencies rely on them. More in our work.
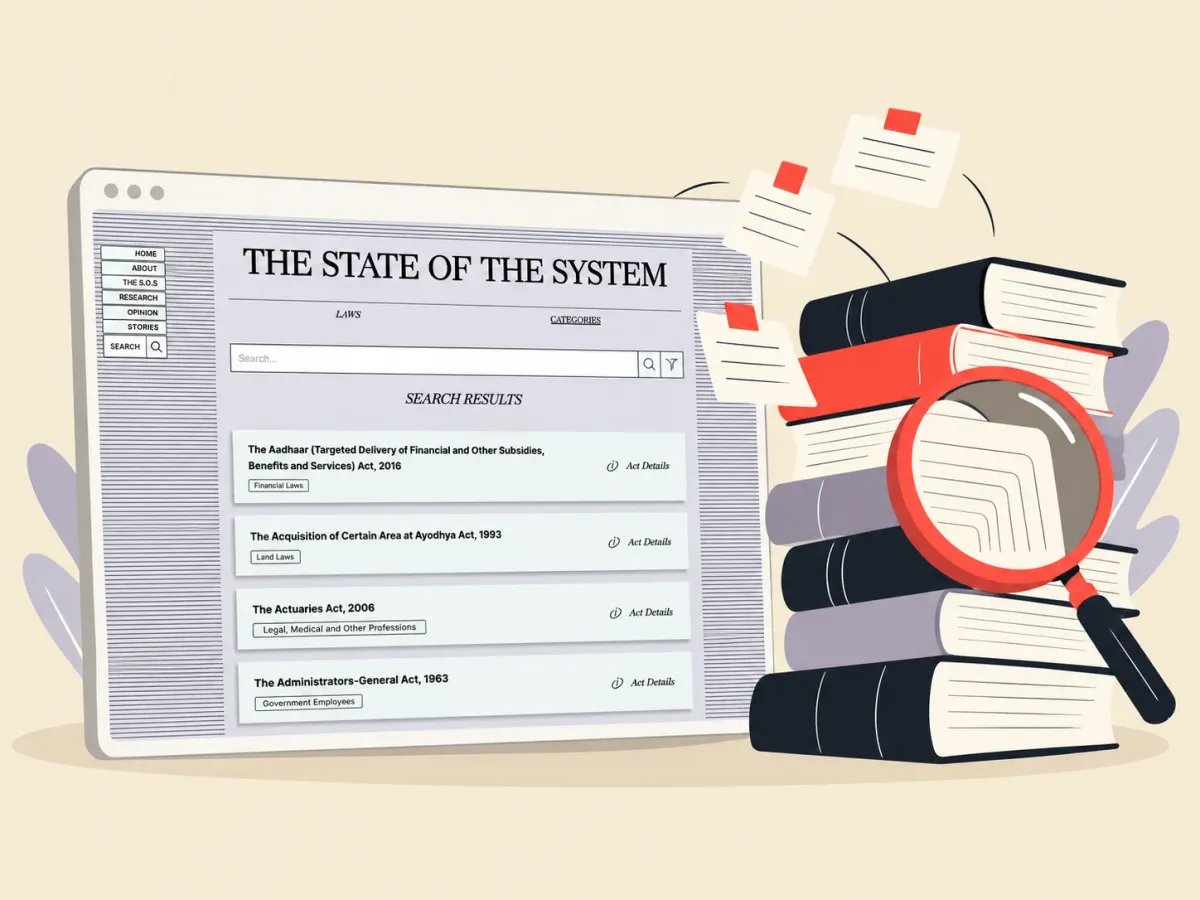
Crime and Punishment: a database of 7,305 crimes across 370 central laws
A scraping engine plus AI extracts the punishment data and tags law sections. Tailwebs built and maintains the database and site, live at crimeandpunishment.in. It cut manual effort by 90%, with higher quality, and states have adopted it. How the pipeline works: research content systems.
The Frontier Tech Repository portal, with the NFTR Assistant built in
We built the portal around how its users work, with AI help built in. The NFTR Assistant answers from the knowledge base, cites its sources and reports unanswered questions to admins. It has answered thousands of questions. How we build assistants: AI chatbot development.
A website redesign that represents CSEP as a brand
The MobiliseHER website and the gender-mobility dashboard
The website, live at mobiliseher-urbanmobility.org, and a dashboard of household-survey data for Bengaluru, Kochi and Ahmedabad. It turns the survey findings into something anyone can explore, city by city.
The MOSIP brand website and the MOSIP Marketplace
A brand website for an ecosystem that serves countries, and the live Marketplace, where adopting countries find compliant devices and software. Engagement rose 30%. More on websites for digital public goods.
eGov's brand websites
We built egov.org.in, live at egov.org.in, and helped on egov.global. Engagement rose 50%.
A government data dashboard
In progress
Policy and research clients








Clutch rating: 4.9 from 10 reviews, including reviews from Vidhi and MOSIP (see the profile).
By sector: government website development, NGO website development and energy data dashboards.
11 Budgets
Budgets that fit a grant cycle
These are the draft ranges for each part.
- Start
Discovery Sprint
Workshops, an audit of what you publish and run, and a written build estimate.
₹1.5–3 lakh
$2,000–4,000
2–3 weeks
- Website
Research Website
Content model, publication library, author and topic pages, search, design, CMS and training.
₹6–20 lakh
$8,000–25,000
8–16 weeks
- Data
Data Portal
An open-data portal or public dashboard suite, with downloads and APIs.
₹12–35 lakh
$15,000–42,000
12–20 weeks
What moves the price: content volume, datasets and integrations.
Every package, with what it includes, is on pricing.
13 FAQ
Questions about research platforms.
What is an ecosystem map?
It is a one-page plan of every part of your digital estate (main site, publication library, data portal, dashboards, microsites, newsletter) showing how they connect, what stays, what retires and what each phase costs.
Where do we start?
With a Discovery Sprint (₹1.5–3 lakh, 2–3 weeks) that audits your content and sites, and ends with an ecosystem map and a phased build plan.
Can the project fit our grant cycle?
Yes, we phase the scope so each phase delivers something usable and lines up with funding tranches and reporting dates.
What happens to our project microsites?
The planning phase decides, site by site, whether each one folds into the main site, stays separate with shared design, or is archived with its links kept working.
How much does a research website or data portal cost?
Draft ranges: a research website ₹6–20 lakh over 8–16 weeks, and a data portal ₹12–35 lakh over 12–20 weeks, depending on content volume, datasets and integrations.
Will the site meet GIGW and WCAG accessibility guidelines?
We build sites to be accessible. Government-linked sites may also need to meet GIGW. Where formal certification is required, it comes from the relevant auditing body.
Can the site and data portal be multilingual?
Yes. We have shipped work in Indian languages other than English, and we plan language versions in the content model from the start, so each translation stays linked to its original.
Can it be hosted on government or MeitY-empanelled infrastructure?
Hosting is chosen with you. Tell us if your organisation requires NIC or MeitY-empanelled cloud, and we plan the build and deployment for it. The empanelment details are on meity.gov.in.