
With the Central Electricity Authority and CEEW's Green Finance Centre (GFC).
01 Data portals and dashboards
Open data portal development and public dashboards for research and policy
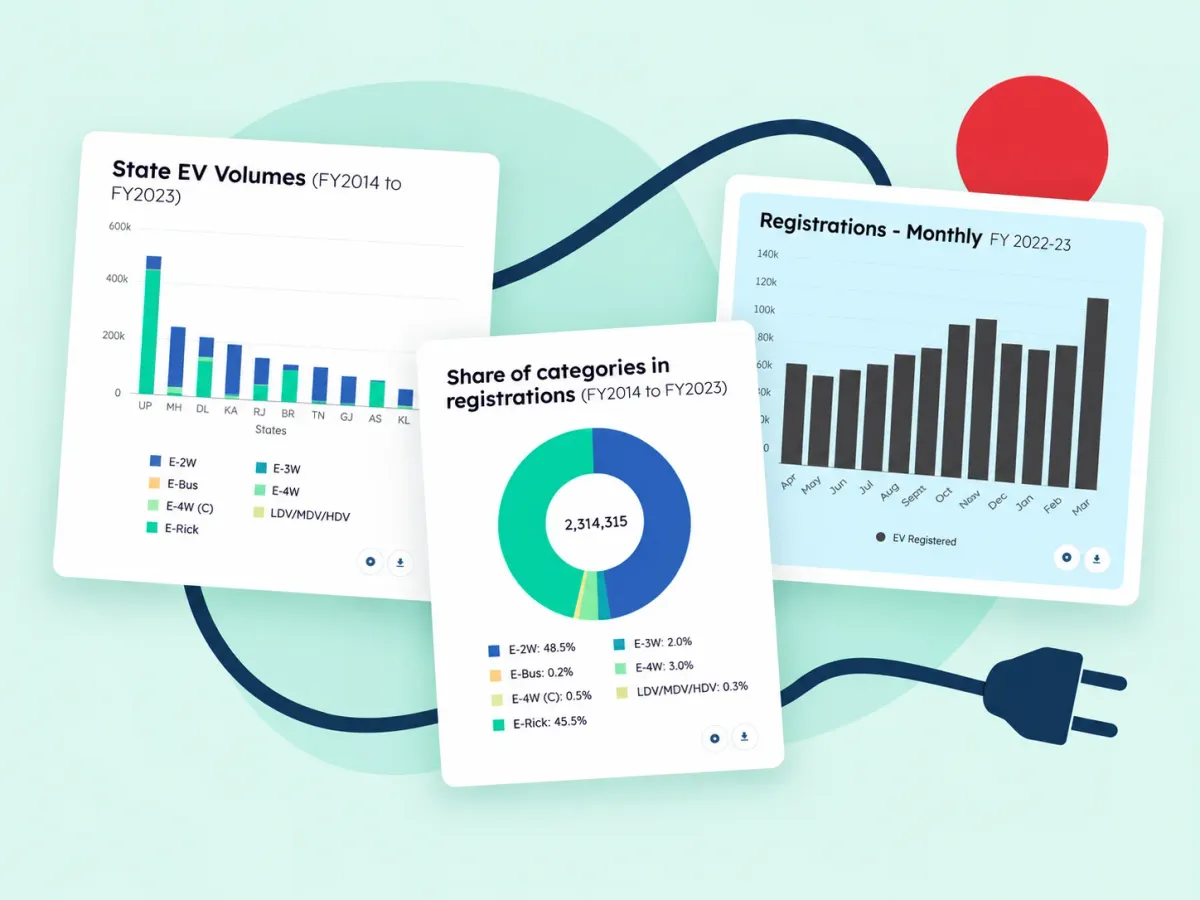
Open data portal development turns your research datasets into something policymakers, journalists and researchers can explore, cite and download. Tailwebs builds open data portals and public dashboards with cleaned data pipelines, methodology pages, downloads and APIs. We built the MobiliseHER gender-mobility dashboard, the GFC EV dashboard and Renewables India with the CEA. Portals typically cost ₹12–35 lakh.
From ₹4 lakh for a dashboard; portals ₹12–35 lakh
02 Dashboard, portal or data story
When does a dashboard need to become a data portal?
When people need to ask their own questions of the data, download it or reuse it through an API, rather than read a fixed set of charts. Each of the three formats does a different job.
Dashboard
- Its job
- Monitors a set of indicators over time: a sector tracker, such as EV adoption or renewable capacity by state.
- Choose it when
- Your readers come back for the same few numbers every month, and need to see the trend at a glance.
- Our work
- The MobiliseHER gender-mobility dashboard, the GFC EV dashboard, and Renewables India with the CEA. See our work.
Data portal
- Its job
- Lets people explore, filter and download whole datasets, each with a licence, a methodology note and an API.
- Choose it when
- Researchers, journalists and partners want to run their own analysis, or build on your data in their own tools.
- Our work
- We have shipped data portals with dataset downloads, licences and an API for partners. Ask us to walk you through one on a call.
Data story
- Its job
- Explains one finding for a policy audience, one chart at a time, with the reading done for them.
- Choose it when
- One result has to reach decision makers who will never open a dataset.
- Our work
- We have shipped data story pages that walk a policy audience through one finding, chart by chart. Ask us to show you one.
Pick by the decision it supports
- Track progress against a target, month by monthDashboard
- Let others run their own analysis, or reuse the dataData portal
- Change one decision with one findingData story
- A whole programme, with all three needsA portal, with dashboards and stories inside it
Chart craft for any business, not only public data, is on data visualisation services.
03 The data audit
Can data from several sources be cleaned and reconciled reliably?
Yes, if the rules are agreed before any chart is drawn. Before design, we audit every source with your researchers, and the output is an indicator list and a methodology draft your researchers approve.
Only this step differs from the planning phase on policy and research.
- Format
- Spreadsheet, PDF table, database export, API or field survey, and how clean each one arrives.
- Owner
- Who publishes the source, and who on your team answers questions about it.
- Update cadence
- Daily, monthly, yearly or one-off, so the portal refreshes when the source does.
- Units and geography
- Units, base years and geography codes, so a state in one source matches a state in another.
- Licence
- What you may republish, and on what terms, before anything goes public.
- Definitions and cleaning rules
- What each indicator means, how gaps and outliers are handled, and who signs the rules off.
04 The pipeline
Public dashboard development starts with the pipeline
Data moves from its sources to the portal in five steps, using the rules from the audit, and the pipeline tells your team when a source breaks.
- 01Partners and your team
Sources
Government releases and APIs, CSV files, surveys and field data.
- 02Pipeline
Clean and reconcile
Cadence, units and geography codes made consistent, by the rules your researchers approved.
- 03Pipeline
Store
One store that every chart, table and download reads from, so the numbers always agree.
- 04Portal
Publish
The portal, the dashboards and the downloads update together.
- 05Your team
Alert
A message when a source fails or changes its format, before a reader notices.
The same pipeline turns a recurring Excel-and-PDF report into an always-current web dashboard, and gives programme monitoring data a public view once it is ready to share.
Want readers to ask questions of your data and documents in plain language, with sources cited? See research content systems and AI chatbot development. To test your datasets and dashboards first, take the research website checklist.
05 After launch
Who keeps the data fresh after launch?
A named owner, agreed before launch: the pipeline wherever the source allows, your analysts wherever it does not. Every chart shows its last-updated date, so nobody has to guess.
- Automated updates
- Where the source publishes on a schedule or through an API, the pipeline pulls each new release.
- An admin panel
- Where it does not, your analysts upload the new file and the charts refresh, with no developer.
- Alerts
- Your team hears when a source breaks or changes format, and the last good data stays up meanwhile.
- Last-updated dates
- On every chart and dataset page, so readers can tell how current the numbers are.
- Technical upkeep
- If you want it, through the Care and Growth plan: ₹50,000–2 lakh a month.
06 Downloads, API and citation
Can people download it, reuse it and cite it?
Yes. Every dataset gets its own page with downloads, a licence statement, a methodology note and a citation line, and partners can use an API.
Dataset pages
What it gives your readersCSV, Excel and JSON downloads, a licence statement and a methodology page for each dataset.
An API for partners
What it gives your readersPartners pull the data into their own tools instead of copying it by hand.
A citation line
What it gives your readersA citation ready to copy for every chart and dataset, with the date it was last updated.
Embed codes
What it gives your readersJournalists and partners can place a live chart inside their own story or report.
Accessible charts
What it gives your readersA text summary and a data table for each chart, colour-safe palettes and full keyboard use.
Government-linked data
What it gives your readersCheck the NDSAP and data.gov.in guidance, and choose an open licence such as CC BY 4.0 or ODbL. See data.gov.in.
07 What we have built
Public dashboards and data visualisation we have built
Public dashboards, tools and a directory we have shipped, and one portal still in progress. The GFC EV and Renewables India dashboards see 10,000+ uses a month, and state agencies rely on them.
A gender-mobility dashboard
Household-survey data for Bengaluru, Kochi and Ahmedabad, shown as one dashboard.
The EV dashboard
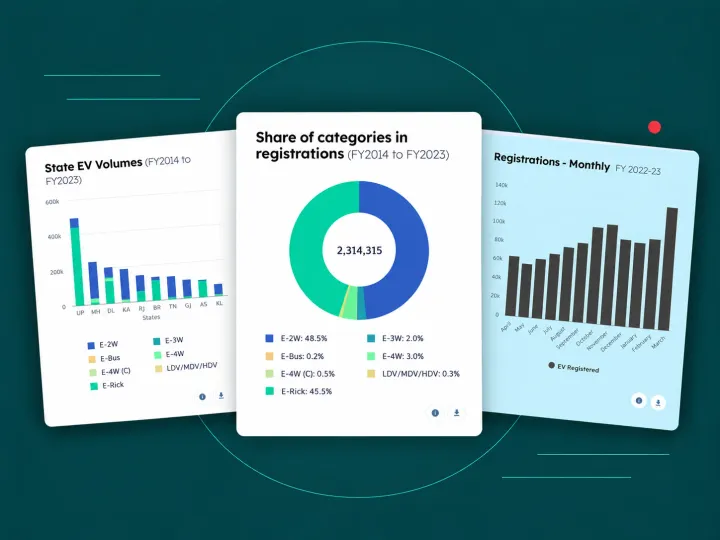
EV volumes by state, the share of each vehicle category, monthly registrations, an EV sales-penetration forecast to 2030, and RTO-level data on a map, with an admin panel behind it. More in our work.
The Renewables India dashboard
Built with the Central Electricity Authority, a government body. It brings in renewable generation data every day at state, regional and national level, generates automated reports, and lets readers download the data in several formats.
The Open Access tool
A live calculator people use to work things out for themselves.
A data dashboard built during COVID
Built for the Sikkim government during the pandemic.
The MOSIP Marketplace
A live public directory where adopting countries find compliant devices and software.
Design and logic from a configuration
Dashboards with so many data points that we generate each page's design and logic from a configuration, so new data doesn't mean new code.
A government data dashboard
Not yet released, so it is named here and not shown.
In progress
Energy and climate data? See energy data dashboards. Publishing with a ministry, mission or PSU? See government website development and portals.
08 Pricing
What dashboard development and a data portal cost
Two packages. Choose once you know which format you need.
- Dashboard
Intelligent Dashboard
Data sources connected and cleaned, a dashboard designed around decisions, and handover.
₹4–12 lakh
$5,000–15,000
4–8 weeks
- Portal
Data Portal
An open-data portal or public dashboard suite, with downloads and APIs.
₹12–35 lakh
$15,000–42,000
12–20 weeks
What moves the price: the number of datasets, cleaning effort, downloads and APIs, languages and accessibility.
Every package is on pricing.
09 FAQ
Questions about data portals and public dashboards.
What is the difference between a dashboard, a data portal and a data story?
A dashboard tracks fixed indicators, a data portal lets people explore and download the data themselves, and a data story explains one finding.
How much does a public dashboard or data portal cost?
Draft ranges: a dashboard ₹4–12 lakh over 4–8 weeks, and a full data portal ₹12–35 lakh over 12–20 weeks, depending mostly on how many datasets need cleaning and whether you need downloads and APIs.
When is a custom portal worth building?
A custom portal is worth it when the public must explore, download and cite your data under your own brand; for a small internal audience with fixed questions, we will tell you if a simpler dashboard is enough.
Who keeps the data up to date after launch?
Your analysts, through an admin upload, or an automated pipeline that pulls new releases; either way the charts refresh and show their last-updated date.
Can users download the data or use an API?
Yes, dataset pages can offer CSV and Excel downloads with licences, and an API for partners where needed.
How do you handle data quality and methodology?
We agree indicator definitions and cleaning rules with your researchers first, and publish a methodology page for each indicator.
Are the charts accessible?
Each chart comes with a text summary, a data table and a colour-safe palette, and works from the keyboard.
What makes an interactive data visualization useful to a policy audience?
Filters by geography, year and indicator, plus a source, methodology note, last-updated date and data download on every chart, so readers can check and cite what they see.