
For 100+ clients. Founded in Bengaluru.
01 Energy and climate
Energy data dashboards and climate data platforms
Tailwebs builds energy data dashboards, trackers and research platforms that make energy and climate data public and usable. We built the whole digital ecosystem for CEEW's Green Finance Centre (GFC), including its EV dashboard, Renewables India with the Central Electricity Authority and the live Open Access tool. We work with think tanks, public energy bodies and climate teams.
02 Dashboards we have built
EV and renewable energy dashboards we have built
Yes. We built the whole digital ecosystem for GFC, including two dashboards, one of them with the Central Electricity Authority, and the live Open Access tool. The two dashboards see 10,000+ uses a month, and state agencies rely on them.
GFC's whole digital ecosystem
The Green Finance Centre's site and tools, planned and built as one system.
The GFC EV dashboard
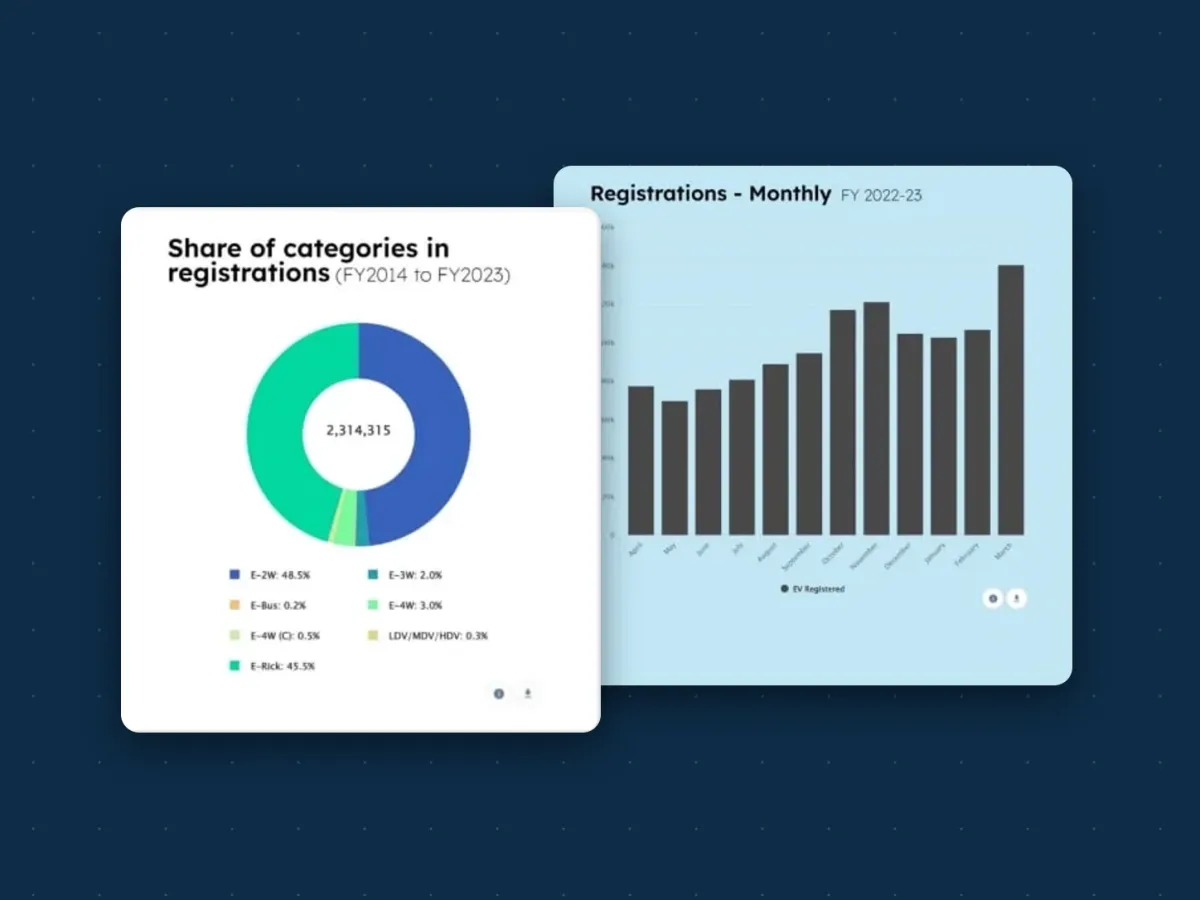
EV volumes by state, the share of each vehicle category and monthly registrations, with an EV sales-penetration forecast to 2030 and RTO-level data on a map. See the GFC EV dashboard on our work page.
The Renewables India dashboard
Built with the CEA, a government body, and it generates automated reports. See Renewables India on our work page.
The Open Access tool
A live tool on the GFC site, part of the same ecosystem.
Energy and climate clients


How public dashboards are planned: data portals and dashboards. What clients say about working with us is in our Clutch reviews.
04 From release to chart
Will it stay current, and will people trust the numbers?
Yes, when the path from each release to each chart is built once and run every time. New releases then refresh the dashboard without a rebuild, and readers can see where each number comes from.
Source releases
Agency publications, such as CEA and MNRE releases, plus your own research data.
Ingestion
A scheduled pipeline picks up each new release, or your team uploads it through an admin screen.
Validation and definitions
Each file is checked against the expected format and the indicator definitions before anything is published.
Indicator layer
Cleaned data becomes the indicators your researchers defined, with each calculation written down once.
Charts, maps, downloads and an API
The same indicators drive every chart, map, download and API call, so they always agree.
What the reader seesEvery chart shows its source, indicator definition and last update date.
How we build dashboards: dashboard development.
05 Rules and conventions
Can we publish this openly, and co-brand it with a government partner?
Usually, yes. Open publishing follows the licence on your data and the attribution rules of each source agency, and a co-branded dashboard follows its government partner’s web guidelines. Your team confirms what applies.
Knowledge, not certification · not legal advice
Open data
Shapes the licence on each download, the attribution line on each chart and where the data is listed.
- India's National Data Sharing and Accessibility Policy (NDSAP) and the data.gov.in portal, for government data: data.gov.in.
- Open licences such as CC BY 4.0: creativecommons.org.
- The attribution terms of each source agency, such as the CEA or MNRE.
Co-branding with government
Shapes accessibility, the visual identity rules and where the dashboard is hosted.
Corporate and emissions data
Shapes how sustainability and emissions data is organised, labelled and explained.
- SEBI's Business Responsibility and Sustainability Reporting (BRSR) framework, for corporate sustainability data: sebi.gov.in.
- The GHG Protocol's conventions, for emissions data: ghgprotocol.org.
Who decides
Your research and legal teams decide the licence and the attribution; we build the dashboard to show them.
06 How it starts
What does an energy data project cost, and what do you need from us?
It starts with a data audit: we review your sources, formats, release calendar and definitions before design. Then a focused dashboard or a multi-dataset portal.
- Step 1
Data audit
Your sources, formats, release calendar and indicator definitions, reviewed in a Discovery Sprint before any design.
₹1.5–3 lakh
$2,000–4,000
2–3 weeks
- Step 2
Focused dashboard
Data sources connected and cleaned, and a dashboard designed around the questions it answers.
₹4–12 lakh
$5,000–15,000
4–8 weeks
- Or
Multi-dataset portal
Several datasets with downloads, methodology pages and an API.
₹12–35 lakh
$15,000–42,000
12–20 weeks
Every package is on pricing.
07 FAQ
Questions about energy data dashboards.
How much does an energy data dashboard cost?
Our draft ranges: the Intelligent Dashboard package, for a focused dashboard, is ₹4–12 lakh, and the Data Portal package, for a multi-dataset portal with downloads and APIs, is ₹12–35 lakh.
Can the dashboard update when new government data is released?
Yes, we build pipelines or an admin upload so new releases refresh the dashboard without a rebuild.
Can you add forecasts or scenarios?
Yes, we can implement your researchers' forecast models and let users change key assumptions, with the method explained on the page.
What does an EV dashboard show?
The GFC EV dashboard we built was made to show EV volumes by state, the share of each vehicle category and monthly registrations, with an EV sales-penetration forecast to 2030 and RTO-level data on a map. Yours would show the measures your researchers choose.
Can we show data at state, district or finer level?
Yes. The GFC EV dashboard maps data down to each RTO, and we build maps and filters down to the level your data supports.
Who owns the data and the dashboard?
You do. You own all custom code, designs and content created for your project once it's paid in full, and the data is yours throughout.
Can the dashboard be co-branded with a government partner?
Yes. The partner confirms which web guidelines and hosting rules apply; we design to them.For Indian government partners that usually means the GIGW guidelines: guidelines.india.gov.in.
Is it interactive data visualization, or only static charts?
Interactive, where your data and readers need it.Typical features: filters by state or year, series comparisons, exact values, each chart's source and update date, and downloads where your licence allows.