Leveraging Python for Data Analysis and Visualization with Pandas: Your Gateway to Data Insights
In today’s data-driven world, the ability to extract meaning from information is crucial. Enter Python and its versatile library, Pandas, your powerful duo for conquering the ever-growing realm of data analysis and visualization. Whether you’re a seasoned analyst or a curious beginner, this blog post equips you with the knowledge and tools to transform raw data into captivating insights, crafting your own compelling data story.
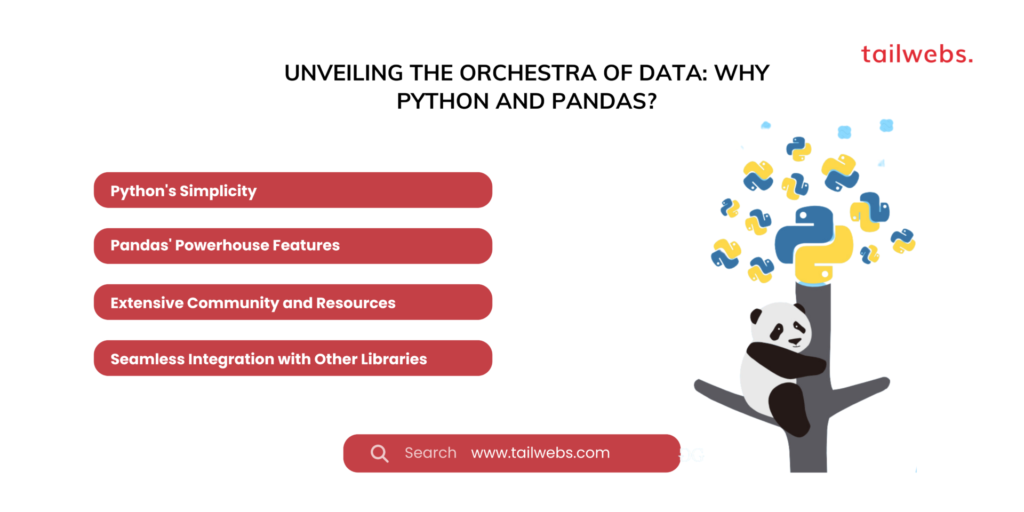
Unveiling the Orchestra of Data: Why Python and Pandas?
Imagine data analysis as a vast orchestra, where various tools and techniques act as instruments, harmoniously collaborating to produce beautiful melodies of understanding. Python serves as the conductor, offering a flexible and readable language, while Pandas acts as a set of versatile instruments, allowing you to manipulate, clean, and analyze data efficiently. Here’s why this combination is ideal:
Python’s Simplicity:
With its English-like syntax, Python requires less memorization and feels more intuitive compared to other languages, making it ideal for beginners.
Pandas’ Powerhouse Features:
Pandas offers a rich set of functionalities for data loading, cleaning, transformation, analysis, and visualization, streamlining your workflow.
Extensive Community and Resources:
Python and Pandas boast vast communities of users and developers, providing abundant resources, tutorials, and support.
Seamless Integration with Other Libraries:
Pandas integrates seamlessly with other popular Python libraries for machine learning, statistical analysis, and more, expanding your analytical capabilities.
Stats Highlighting the Significance of Data Analysis:
- 80% of businesses believe data analytics delivers a competitive advantage. (McKinsey Global Institute, 2022)
- Companies leveraging data-driven decision-making report 5% to 6% higher profitability. (Harvard Business Review, 2021)
- Learning Python and data analysis skills is highly sought-after, offering significant career opportunities. (Burning Glass Technologies, 2023)
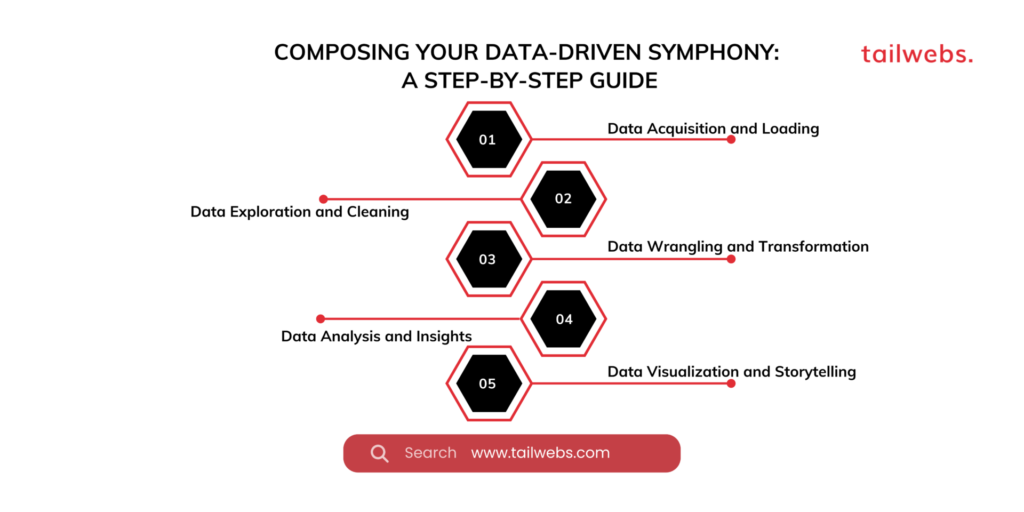
Composing Your Data-Driven Symphony: A Step-by-Step Guide
Ready to transform data into valuable insights? Let’s delve into the key steps:
1. Data Acquisition and Loading:
Import data from various sources like CSV files, databases, or APIs using Pandas’ read functions.
2. Data Exploration and Cleaning:
Analyze data structure, identify missing values, outliers, and inconsistencies using descriptive statistics and visualization techniques.
3. Data Wrangling and Transformation:
Clean and manipulate data through filtering, sorting, grouping, and creating new features to suit your analysis.
4. Data Analysis and Insights:
Apply statistical methods, group comparisons, and hypothesis testing to extract meaningful conclusions from your data.
5. Data Visualization and Storytelling:
Craft compelling visualizations like bar charts, line graphs, and heatmaps to effectively communicate your findings to diverse audiences.
Recommended Resources and Tools:
- Pandas Documentation: https://pandas.pydata.org/docs/
- DataCamp Pandas Tutorial: [invalid URL removed]
- Seaborn Visualization Library: https://seaborn.pydata.org/
- Kaggle Datasets and Competitions: https://www.kaggle.com/
- Interactive Python Notebook Tutorials: https://jupyter.org/
Beyond the Basic Notes: Building a Symphony of Expertise
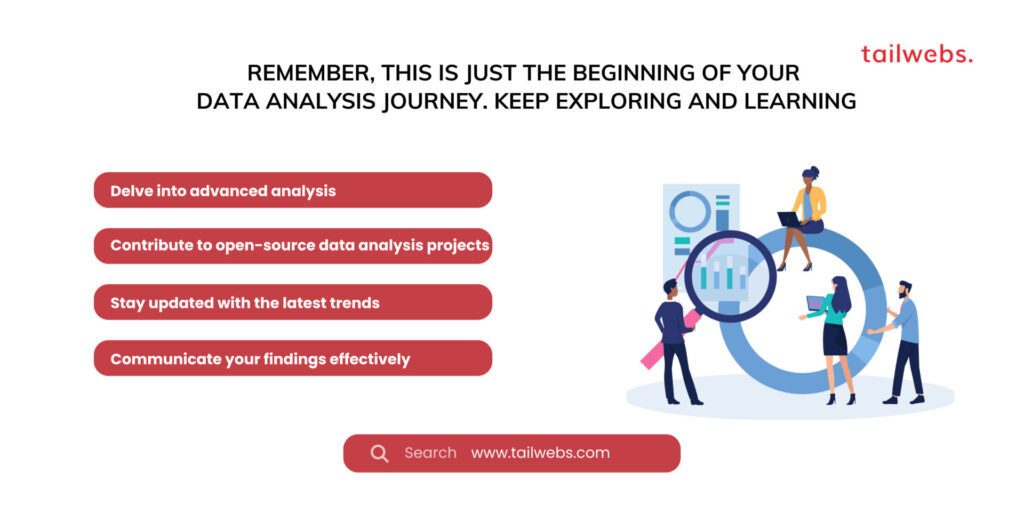
Remember, this is just the beginning of your data analysis journey. Keep exploring and learning:
Delve into advanced analysis:
Leverage statistical modeling, machine learning, and time series analysis for deeper insights.
Contribute to open-source data analysis projects:
Share your knowledge and gain valuable experience.
Stay updated with the latest trends:
Data analysis tools and techniques evolve rapidly, so continuous learning is key.
Communicate your findings effectively:
Hone your storytelling skills to present data insights in an engaging and impactful way.
Ultimately, the future of data analysis belongs to those who can transform information into actionable insights, driving informed decision-making. By adopting this mindset, you can transform from a passive data observer to a skilled conductor, composing a harmonious melody of knowledge and progress that shapes a better future for your organization and the world around you.
Conclusion: Conduct Your Own Data-Driven Symphony with Python and Pandas
Remember, mastering data analysis isn’t a solo performance; it’s a collaborative melody composed of countless instruments. As you navigate your journey, consider the broader impact:
- Promote data literacy and accessibility: Empower everyone to understand and utilize data for informed decision-making.
- Advocate for responsible data practices: Ensure data privacy, security, and ethical collection and usage.
- Use data analysis to tackle global challenges: Address climate change, poverty, and other pressing issues with data-driven solutions.
- Contribute to open-source data analysis initiatives: Foster a collaborative community and accelerate advancements in the field.
Ultimately, the future of data analysis belongs to those who embrace continuous learning, collaboration, and ethical practices. By adopting this mindset, you can transform from a single musician in the data analysis orchestra to a skilled conductor, composing a harmonious melody of innovation and progress that shapes a better future for all.

