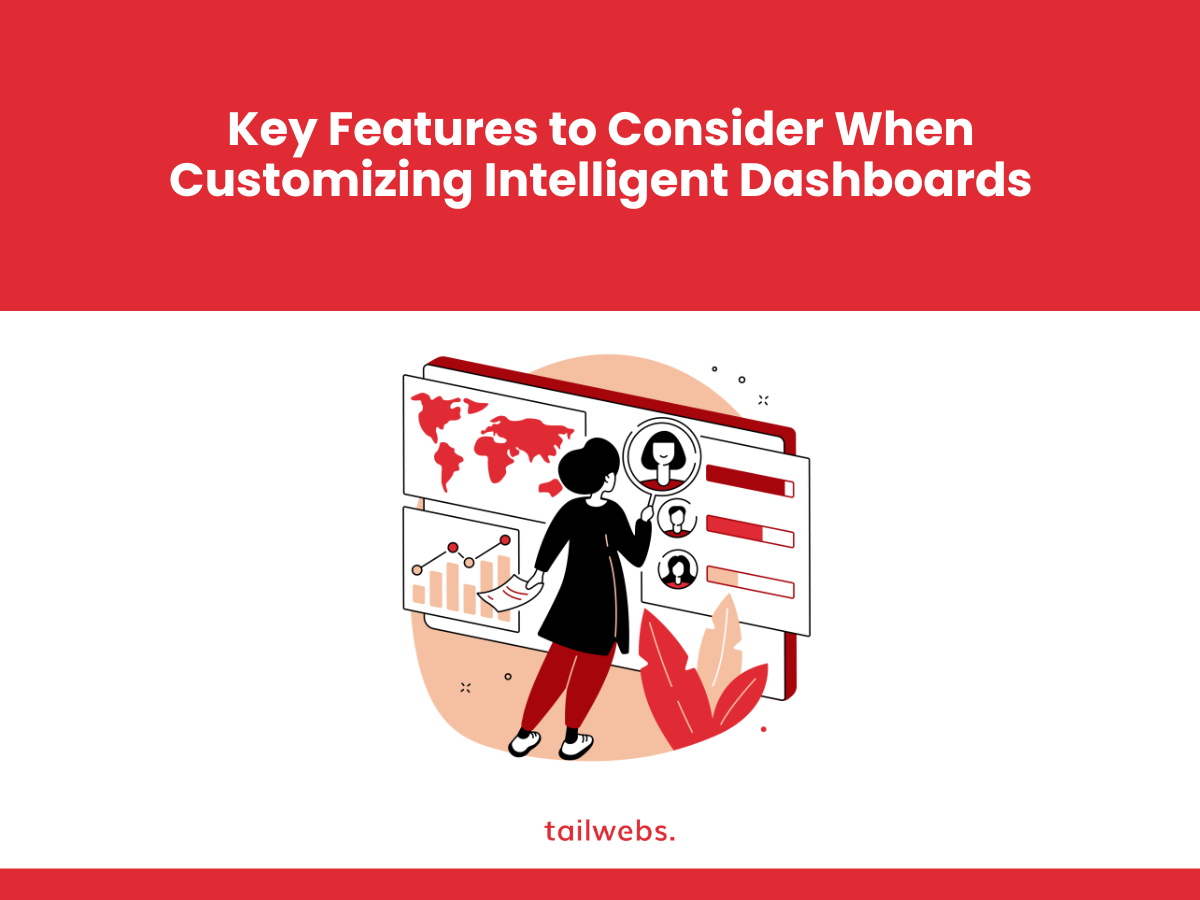
The rapidly developing world that is data-driven heavily relies on analytics and real-time insights to reach an informed decision. Intelligent dashboards play a significant role in helping to represent the data in a visually analyzable manner. This enables organizations to monitor key performance indicators (KPIs) and keep track of their goals and progress toward them. Off-the-shelf dashboard solutions provide standard functionality but it is the customizing intelligent dashboards that help in unlocking additional benefits and allow them to be tailored as per the specific business requirements. In this blog, we explore the significance of the customization available in intelligent dashboards and also the top five features that can be considered when the customization journey is embarked upon.
To begin with, let us understand what “Intelligent Dashboards” are.
Intelligent dashboards can be defined as interactive data visualization tools that help in the consolidation of information from various data sources into a single and user-friendly interface. The intelligent dashboard allows its users to analyze and explore the data in a visual format and provide valuable insights at a glance. Intelligent dashboards are preferred as they use data visualization techniques such as charts, graphs, and gauges which help in the easy identification of trends, and patterns and also aid in simplifying the data for better decision-making and driving operational efficiency.
The importance of customizing intelligent dashboards:
It is understood that the pre-built dashboard solutions offer a wide range of functionalities but customizing the intelligent dashboards can bring in some extremely useful advantages to the businesses. The below-mentioned reasons explain in depth the significance of the importance of dashboard customization:
Aligning the business and its objectives:
Every organization has its own distinct goals and metrics that define its path toward the success of the organization. By customizing an intelligent dashboard, one ensures that the chosen metrics to evaluate the success using the KPIs are visualized to give a more clear picture of the data and provide with actionable insights.
Enhancing user experience
: By tailoring the dashboard as per the specific requirement of the user, customization improves the entire user experience. This includes the simplification of the interface, incorporation of intuitive navigation, and providing personalized features that enable users to access the in a quick, easy, efficient, and understandable manner.
Integrating with the existing systems:
Dashboard customization allows seamless integration of the existing and newly collected data from various sources that allow the elimination of the silos, and provides a holistic view of the performance of the organization
Scalability and Flexibility
: When businesses evolve and grow, data requirements change. Through customization, the intelligent dashboards can adapt to the changing requirements of the organization which leads the path to scalability and flexibility. New data sources, visualizations, and functionalities can be added to meet the evolving demands of the business.
Consistency in branding:
The customization of the dashboards allows the organization to meet the brand guidelines, providing consistency in the reports as they follow the logo, color scheme, and design elements, creating a uniform visual identity. This leads to the reinforced image of the organization and fosters a sense of familiarity among the brand users and brings in trust.
Top 5 Features to Consider When Customizing Intelligent Dashboards:
Interactive Data Exploration:
Interactive data exploration features becomes an important aspect of modern data analytics and business intelligence tools world today, as it permits users to interact and manipulate data in real-time in order to get valuable insights. This feature is extremely crucial while the customization of intelligent dashboards because this empowers the users to analyze the complex dataset in a dynamic and flexible manner. This leads to more informed decision-making curating a path to improved business outcomes.
Of many benefits, the key benefit of interactive data exploration is its ability to reveal hidden patterns, trends, and correlations in the data. According to a survey conducted by Forbes, 62% of executives believe that data-driven decision-making leads to improved business outcomes. Interactive data exploration, which is an essential feature of a customized intelligent dashboard, allows the users to gain deeper insight from the data which otherwise might have been overlooked.
Incorporating features like drill-down, filtering, and sorting options significantly enhances the user experience and data analysis process. A study by Aberdeen Group found that companies using interactive data visualization have a 22% higher adoption rate among users compared to those using static reports. This higher adoption rate is attributed to the ease and flexibility of exploring data interactively.
Real-Time Data Updates:
The real-time data updates capture the current data and hence play an essential role in enhancing the effectiveness of the intelligent dashboards, enabling the users to access the most recent and relevant information. This information carves a way to make timely and well researched and well-informed decisions. These dashboards are dynamically updated through which they empower organizations to stay agile in the rapidly evolving business landscape, leveraging real-time data and providing apt statistics to respond quickly to the changing circumstances and profit from the emerging opportunities. It also becomes feasible to predict and tackle the potential challenges.
In the fast world, today, every decision and aspect of business operations is driven by data. Static and outdated information that is not effectively stored may lead to missed opportunities or loss. Real-time data tracking, on the other hand, provides a live overview of the performance of the organization in the market. It allows comprehension of the ongoing processes and amends them according to market trends and performance metrics. In the longer run, through real-time data, quick policy and strategy becomes feasible.
By customizing dashboards to display real-time data and statistics, organizations can monitor key performance indicators (KPIs) in real time, eliminating the need for manual data gathering and reducing the risk of reliance on stale insights. This dynamic approach fosters a proactive rather than reactive decision-making culture, as stakeholders gain access to accurate and current information instantaneously.
Personalization in Visualization
: Personalization and customization in visualizations enable the users to practice control over their data presentations, allowing them to create chart types and visual representations to meet their specific requirements and enhance data comprehension. With a wide range of datasets available, many data types and metrics are required to be curated, making it crucial for employing distinct visualizations to convey information more effectively.
By offering a wide number of customization options, the users can use the dashboard to craft visualizations that align precisely with the nature of the data leading to an ensured conveying of the message in a meaningful way. The flexibility in the intelligent dashboards allows the selection of appropriate chart types amidst the multiple options like bar graphs, pie and line charts, scatter plots, and more, depending on the characteristics of the data and insights that are required to be highlighted.
Notably, the ability to customize visualizations fosters a more engaging experience for users and their audience. By presenting data in an aesthetically appealing and interactive manner, viewers are more likely to be captivated and invested in exploring the information further. This can be especially useful in business settings, educational environments, and data-driven storytelling, where captivating visual representations play a significant role in keeping the audience attentive and interested.
Role-Base Access Control
: The role-based access control (RBAC) plays an important role in the customization of intelligent dashboards to meet the diverse requirements of multiple stakeholders of different accessibility clearances present within an organization. It enables administrators to establish distinct user roles and allows them permissions specific to their roles and responsibilities. With the implementation of RBAC, the organizations can foster data security and maintain confidentiality and mitigate the potential risks associated with the misuse of unauthorized data.
In RBAC, user roles are defined based on the individual’s position, job function, or hierarchical level within the organization. For instance, roles could include executives, managers, analysts, and general employees, each with varying levels of access and data privileges. This granular control ensures that sensitive information remains restricted to authorized personnel, thus preventing accidental or intentional breaches.
With RBAC in place, administrators can easily manage and update user permissions as roles evolve or personnel changes occur. This adaptability simplifies the onboarding process for new employees and minimizes the risk of data exposure when employees transition to different roles within the organization.
Alerts and Notifications
: Integrating alerts and notifications into intelligent dashboards is a powerful strategy that fosters proactive decision-making within an organization. Users are promptly notified of significant developments in the data by configuring these features to trigger when specific metrics or thresholds are met or surpassed. This timely dissemination of information empowers users to respond swiftly and effectively, leading to better outcomes and improved overall performance.
Alerts and notifications are designed to keep users informed about crucial changes or anomalies in real time. For example, if a sales team sets a target revenue goal, they can configure the dashboard to send an alert when that goal is achieved or exceeded. Similarly, in the context of website analytics, administrators can receive notifications when website traffic experiences unusual spikes or drops, indicating potential issues that require immediate attention.
The advantage of such proactive notifications is two-fold. Firstly, it enables users to take immediate action based on emerging trends or critical thresholds, preventing problems from escalating and capitalizing on favorable opportunities. Secondly, it allows users to investigate the root causes of unexpected changes in data promptly. Early detection and swift responses to anomalies can save valuable time and resources, preventing small issues from snowballing into major challenges.
Conclusion:
As the importance of data-driven insights grows, customized intelligent dashboards provide organizations with a competitive edge by enabling them to harness the full potential of their data. These dashboards serve as a central hub for data analysis, enabling seamless collaboration across departments and facilitating a cohesive understanding of the organization’s performance.
In conclusion, the significance of customizing intelligent dashboards cannot be overstated. By tailoring these dashboards to meet specific business needs and incorporating features such as interactive data exploration, real-time updates, customizable visualizations, role-based access control, and alerts and notifications, organizations can unleash the true power of their data. In doing so, they are equipped to make well-informed decisions swiftly, optimize operational efficiency, and adapt effectively to the dynamic business landscape. As businesses continue to rely on data to gain insights and maintain a competitive edge, customizing intelligent dashboards remains an indispensable strategy for organizations striving for success and growth in the modern data-driven era.


