Project Objective: To create a Electric Mobility Dashboard that provides you with updates on EV volumes across the nation, from the data provided by the client.
Build the User Experience, Create Easy to the Eye UI, Make the Dashboard an Interactive one Keep the Viewers hooked to the Dashboard, Visualise the Quantitative Data in a Qualitative form
Hours delivered back to the business
SOX compliance in Settlement process automation
Success rate of bot case completion
For functional release of OBT, RTS and OGS
The Challenge
Unorganised Data: They had data scattered in different places like PDF’s, Excels. Word Docs, Tables. Etc. They wanted to bring together the data in one place & help in building an impact.
Hard to Visualise Tools: Dashboard Building tools were a bottleneck with respect to the designs that they wanted to visualise.
Daily Changing Data: The Data Changed everyday for them. Collecting data in a easy to understand admin panel was a problem as the data was input by several people across India.
What did
Tailwebs do
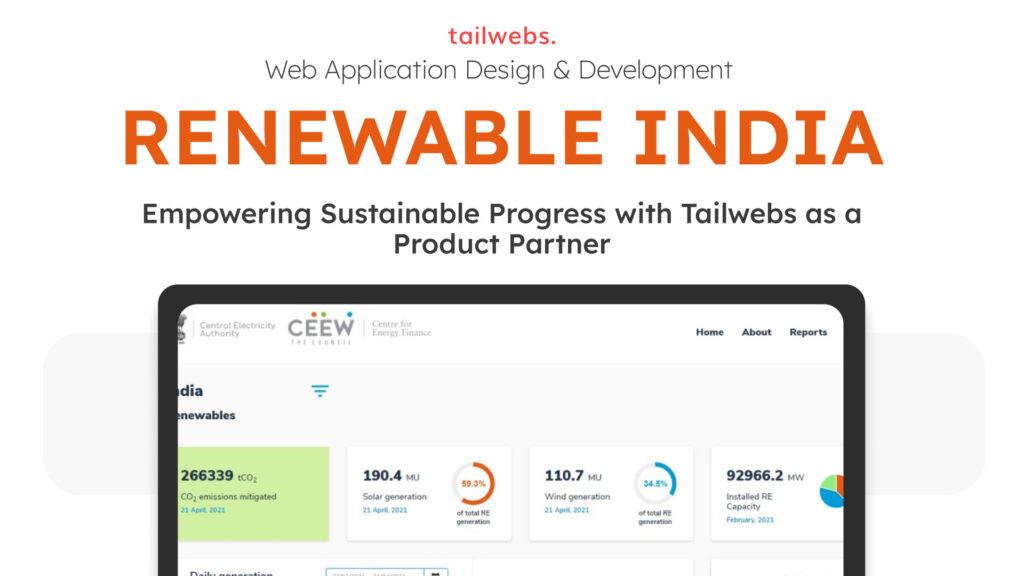
Tailwebs has created a comprehensive web tool that understands, analysis, and predicts EV (Electric Vehicle) sales penetration by 2030. Not only that, but this tool also broadcasts the impact of EV sales on jobs, growth, and sustainability.
This tool can be utilized by students, researchers, academicians, experts, journalists, and policymakers. The tool gives you an overview of how Indians are accepting clean renewable energy for vehicles nationwide.
We helped them Bring together their unorganised data into a Digitized Tool, with a completely custom admin panel and user interface.
With API Integrations, Custom Chart & Map Integration & RTO Level Data Integration, Tailwebs helped CEEW build a bigger and better impact with their researched Data.

The Results
- 2 Volume Monitors
- 2 EV Tools
- 1 State Policy Matrix
- 1 Heat Map
- 1000+ Monthly Page Views
- 3+ Mins Average Session Time
- 500+ RTO Level Sales Data


